An AI feature that is working and an AI feature that is failing can look identical from the outside: both return a paragraph, on time, without an error. The difference is only visible if you can see what happened inside the request and what happened to its result afterwards. This post covers what we record, how we use it, and the support ticket that convinced us to record more.
The ticket
"The assistant gave me a wrong answer yesterday." That was the whole report. We had request logs: a timestamp, a user, a status code. We did not have the question, the passages retrieved, the prompt assembled, the model version, the tool calls made, or the answer. We could not reproduce the problem, could not tell whether it was retrieval or generation, and could not tell whether anyone else had hit it. We apologised and changed nothing, because there was nothing to change.
A log line that says "200 OK" is not observability for a system whose failure mode is a confident wrong answer.
The trace we record now
Every request produces a trace with a span for each stage: the input as received, any classification or routing decision, the retrieval query and the passages returned with their scores, the exact prompt sent to the model with the model version, each tool call with its arguments and result, the raw output, and the post-processed response. Each span carries timing and, for model calls, token counts and cost. The trace is tied to the user and session, and to a feature flag or prompt version so we can compare before and after a change.
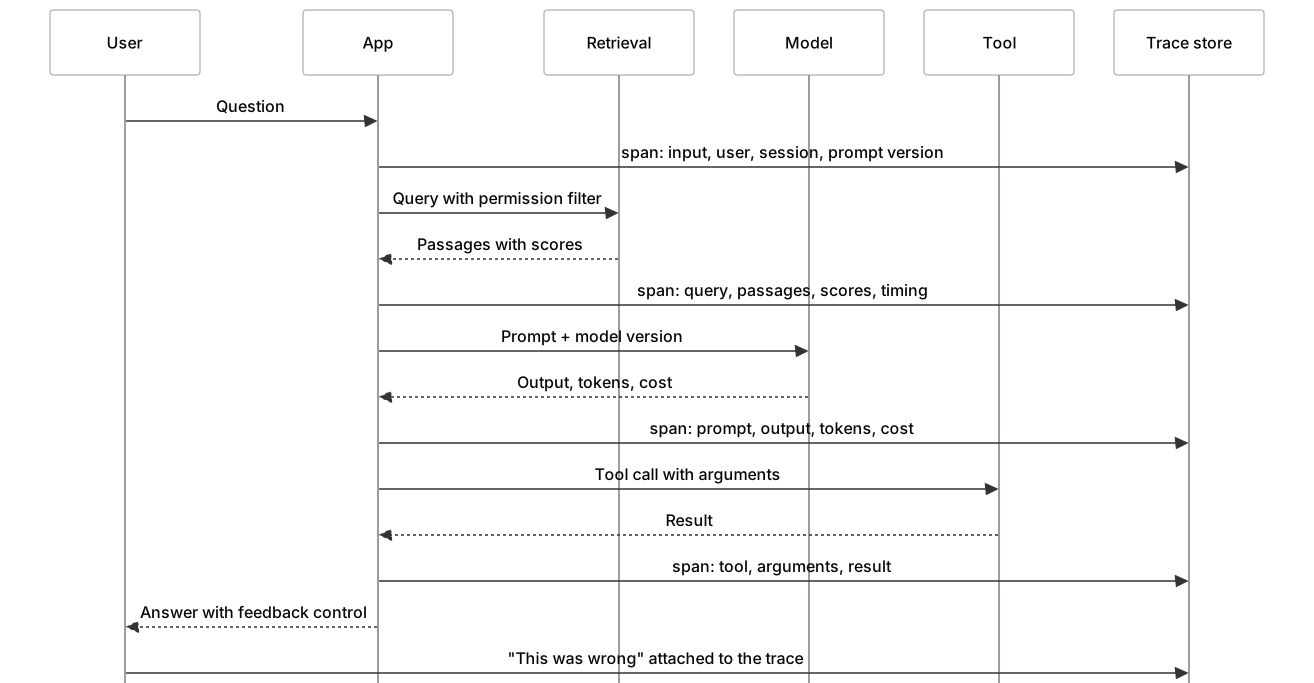
With that in place, the next "wrong answer yesterday" ticket took ten minutes: the trace showed the retrieval had returned an older version of a policy document, because a metadata field had not been updated when the new version was uploaded. The fix was in the ingestion pipeline, not the model, and it fixed the problem for everyone.
Drift: watching the inputs and outputs move
Traces are for individual requests. Drift monitoring is for populations. We track the distribution of what users ask, the distribution of what the system answers, the share of answers that are refusals, the average number of passages retrieved and their scores, and for classification and extraction features, the distribution of predicted labels. When any of these move outside their normal range, someone looks. A rising refusal rate has meant, on different projects, a broken index, a changed document set, and a provider model update that made the model more cautious. All three were caught by the same chart.
Cost and latency, per feature and per tail
Cost and latency are observability signals, not only finance and performance ones. We chart them per feature, per user group and per request percentile. The tail matters most: the ninety-ninth percentile of tokens per request is where the runaway conversations and the abuse attempts live. A budget alert on the tail has caught a looping agent and a user pasting a database export into a chat, both before they became problems.
The feedback loop is the point
Everything above serves one purpose: turning what happens in production into improvements. Every answer has a way for the user to say it was wrong, and that signal is attached to the trace. Reviewer corrections in automation queues are attached to their traces. Human-graded samples from the evaluation process are drawn from real traces. Together they form a stream of labelled examples that becomes the next version of the evaluation set and, where a model is trained, the next training data.


A system with this loop running improves every month. A system without it only degrades, because the world it was built for keeps changing while it stands still.
Security of the observability data
The trace store is the most sensitive dataset in the system, because it contains everything users asked and everything the system saw. It gets the same access control as the source data, a retention policy, and redaction of identifiers where the investigation does not need them. Access to traces is itself logged. We also make sure that what is recorded about a user is consistent with what they were told, because a trace store that contradicts a privacy notice is a liability rather than a tool.
Purposefully observable
Observability is not dashboards for their own sake. It is the ability to answer three questions quickly: what happened on this request, is the system behaving differently from last week, and what did we learn that should change the next version. If you can answer those, you can operate an AI system. If you cannot, you are hoping.
- Trace every stage of every request, with inputs, outputs, timing and cost.
- Watch distributions, not just errors: questions, answers, refusals, retrieval scores.
- Chart cost and latency by feature and by tail.
- Attach user feedback and reviewer corrections to traces.
- Feed labelled examples back into the evaluation set.
- Protect the trace store like the source data.